InBox KPI
Version 6.8.32
Creation date 2022-10-03
Resources
This module aims to create key performance indicators for panel calls from user-defined parameters.
Prerequisites
Framework
The following versions of Znuny Framework are supported:
- [6.0.x]
- [6.1.x]
- [6.2.x]
- [6.3.x]
- [6.4.x]
Modules
The following modules are required:
- InBox Core 6.25.7 or superior
Operational system
The following operating systems are required:
- [None]
Software de Terceiros
The following third party software is required:
- [None]
Installation
bin/otrs.Console.pl Admin::Package::Install /path/to/InBox\ KPI-6.8.32.opm
API
Click here to access the module API.
Configuration
Defining if the dark background button will appear
This setting is responsible for defining whether or not the add dark background button in the KPIs will appear. To do this navigate to the 'Administration -> System Configuration' menu and look for "KPI::Core::BlackBackground":
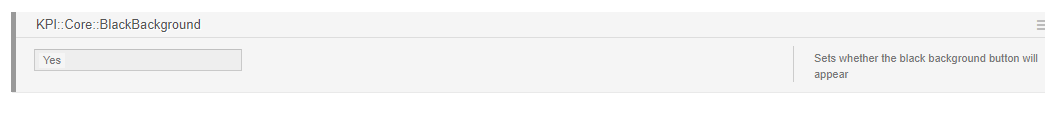
Set to 'Yes' so that the button below appears in KPI and makes the KPI dark background:

Defining Columns That Will Appear that KPI Performs a Ticket Search
This setting defines the columns that can be filtered in the ticket search result display of the agent interface with KPI. Only calling attributes, dynamic fields (DynamicField_NameX), and customer attributes (for example, CustomerUserPhone, CustomerCompanyName, ...) are allowed.
To do this navigate to the 'Administration -> System Configuration' menu and look for "Ticket::Frontend::AgentKPISearch ###DefaultColumns":
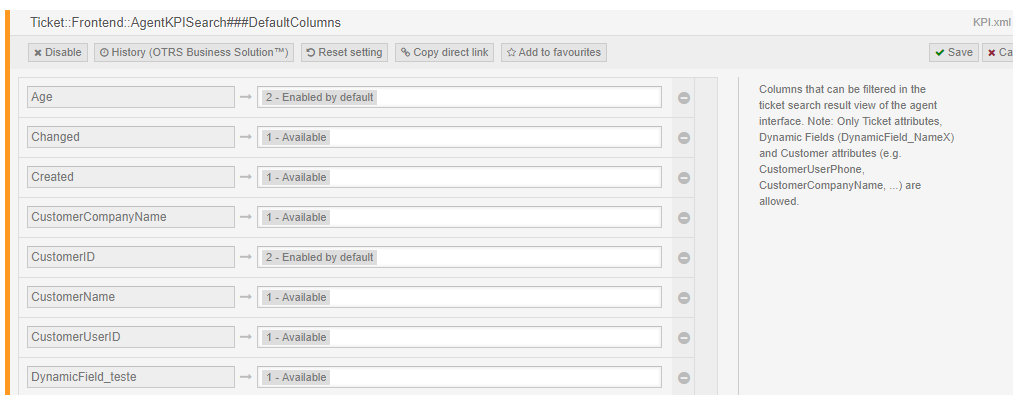
These columns are displayed when you click on a KPI.
Usage
KPI Creation
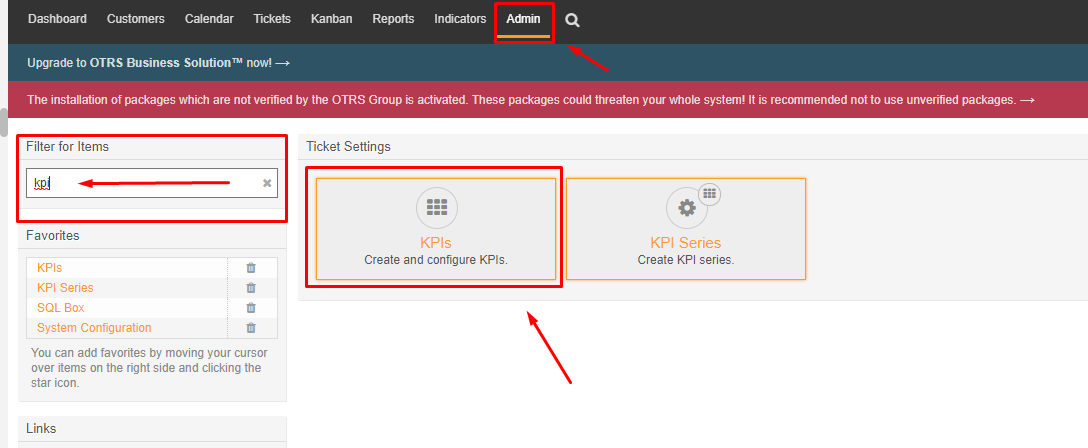
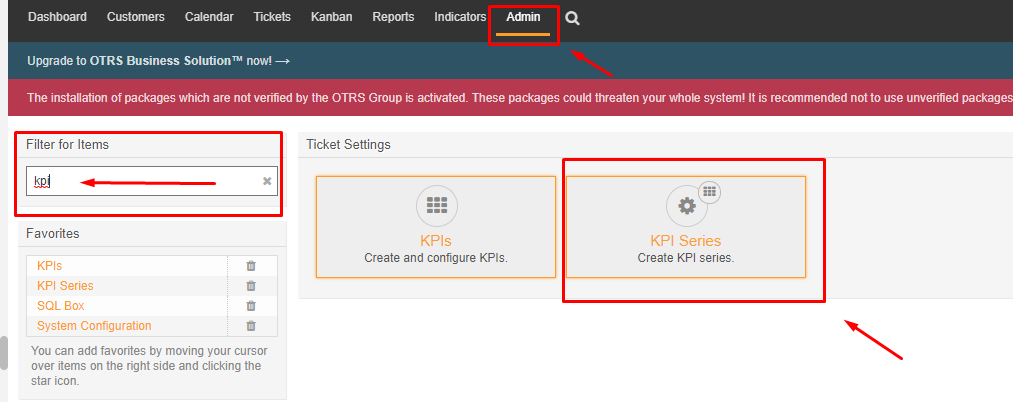
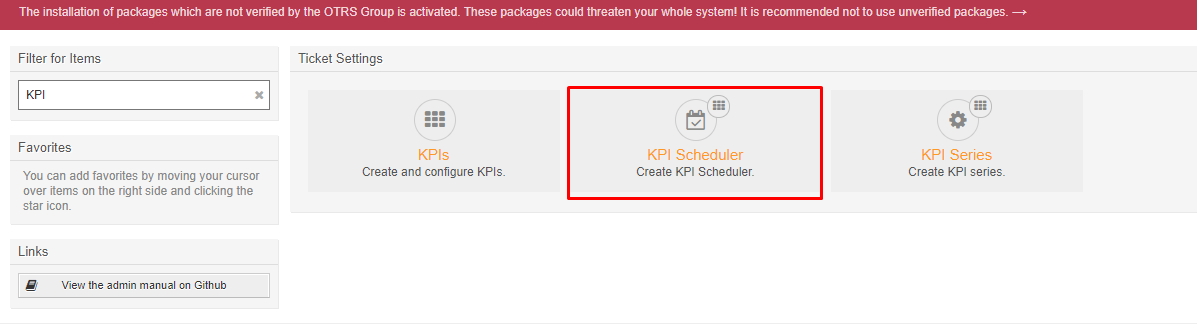
In the top menu select the "Administration" option. After selecting it, filter the settings by entering "KPI" in the "Filter for Items" field. In the "Call Settings" select "KPIs":
At the "KPI Manager" screen, go to the Actions menu and select the objects you want to add KPI:
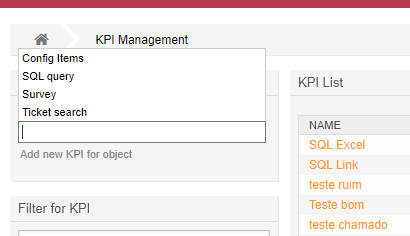
- Selecting the item "Ticket Search":
Enter the fields according to your preference in the 'General' field:
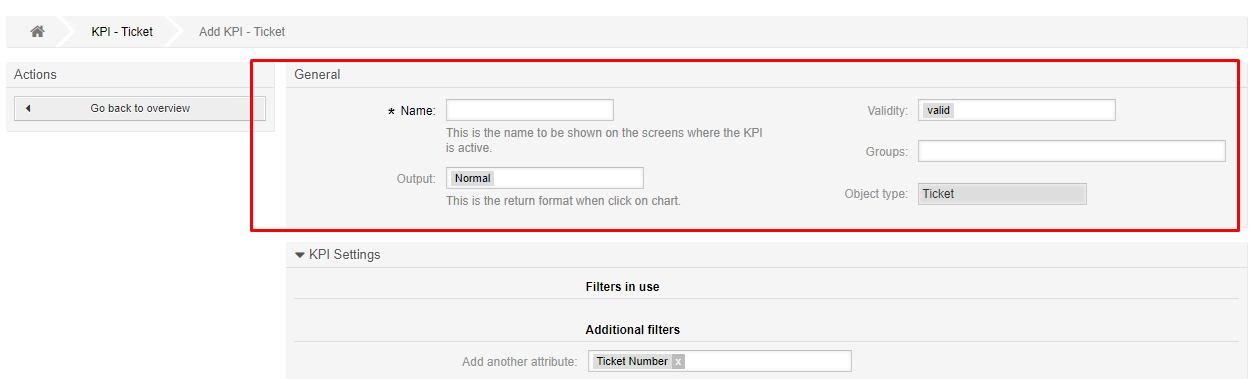
Name: This is the name to be displayed on screens where KPI is active.
Validity: Split between valid and invalid
Exit: This is the return format when you click on the graph.
Groups: User Access Group
Enter the fields according to your preference in the '** KPI Settings **' field:
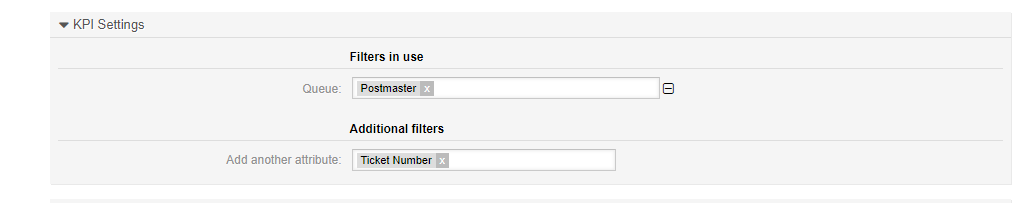
These fields will be considered as the call filters for the KPI.
Enter the fields according to your preference in the '** View Settings **' field:
First define whether the chart type will be ** Numeric ** or ** Chart **:
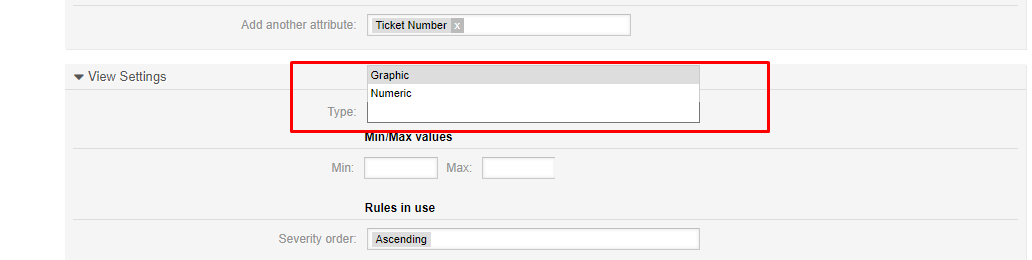
The 'Numeric' type creates an indicator with the number of calls found by the filter.
Already type 'Graph' creates a chart of gauge being necessary to fill in the fields below:
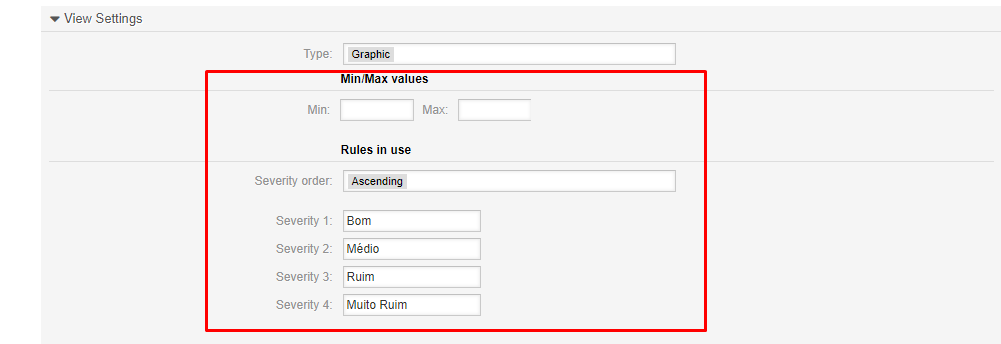
*Important: Setting Min / Max KPI Values:
The KPI works as follows: It captures the maximum amount that you, the user,
informed and divide by 4 to perform display.
After completing the fields, click the Submit button.
- Selecting the item "SQL Query":
Enter the fields according to your preference in the 'General' field:
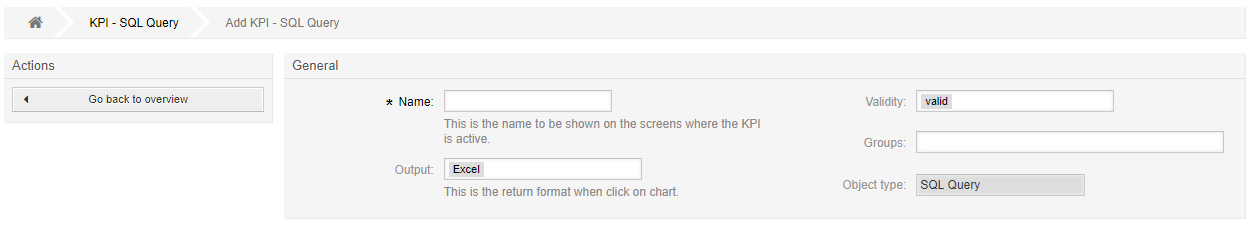
Name: This is the name to be displayed on screens where KPI is active.
Validity: Split between valid and invalid
Exit: This is the return format when you click on the graph. Currently this type of chart only supports Excel.
Groups: User Access Group
In the 'Options' field you can define an SQL query that KPI will use as a count. ** Remembering that each line returned by the select created is counted **:
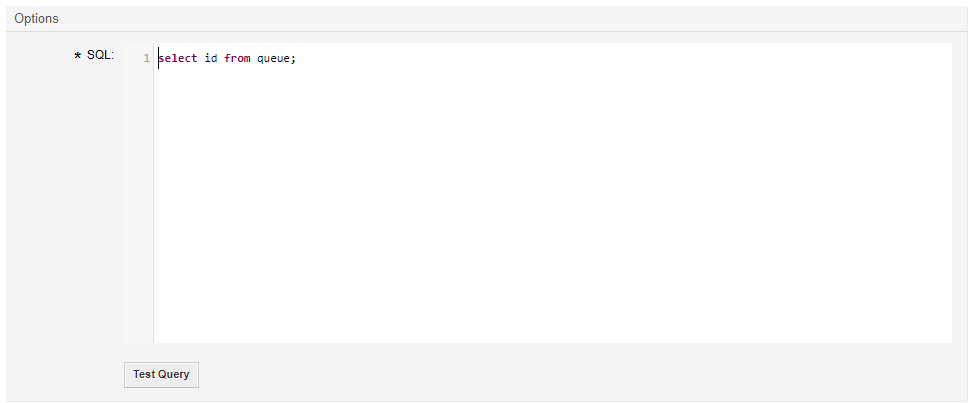
The test button shows the result of the query or if there were any errors with it:
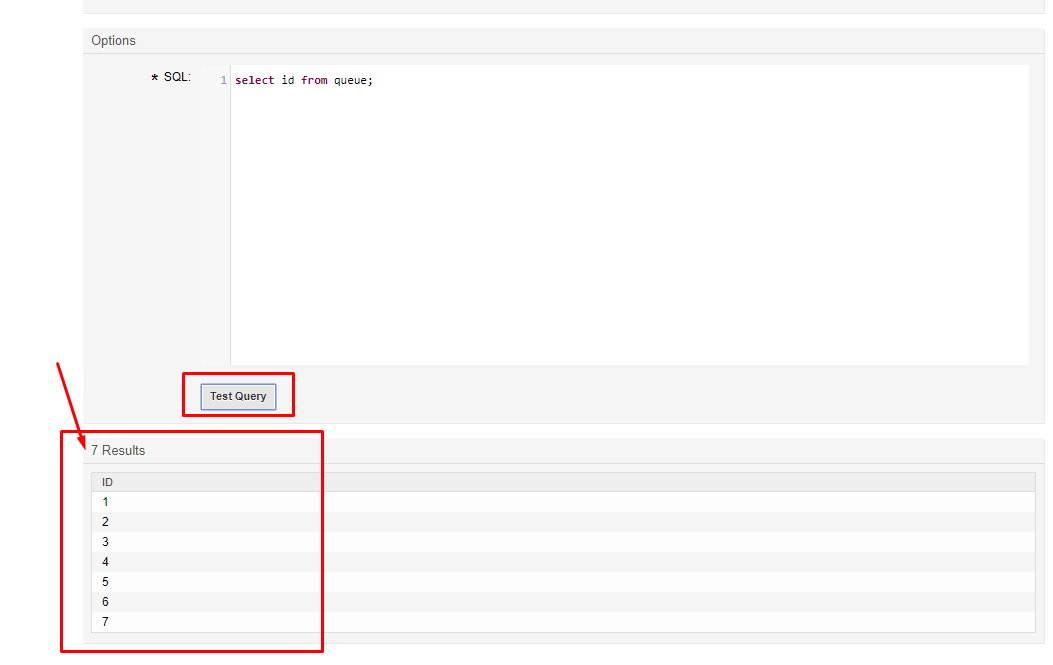
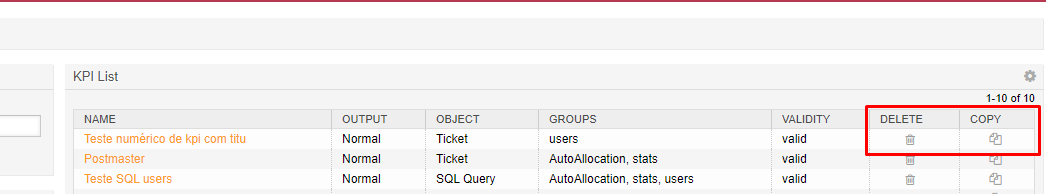
After that click save. You will be able to view the registered KPI, as well as delete or copy them:
- Selecting the item "Chart with SQL Query":
Enter the fields according to your preference in the 'General' field:
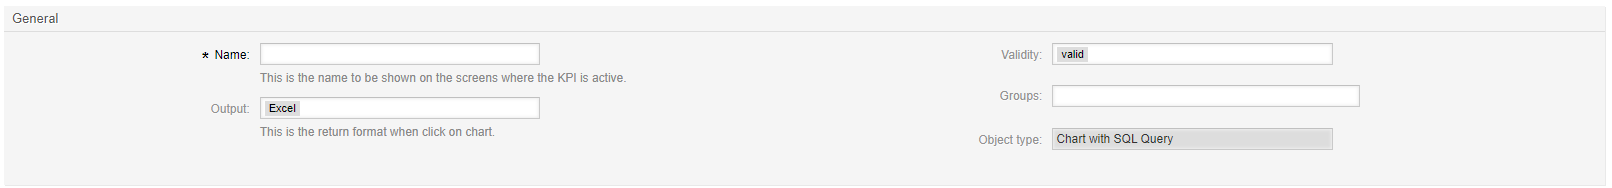
Name: This is the name to be displayed on screens where KPI is active.
Validity: Split between valid and invalid
Output: This is the return format when you click on the graph. Currently this type of chart only supports Excel.
Groups: User Access Group
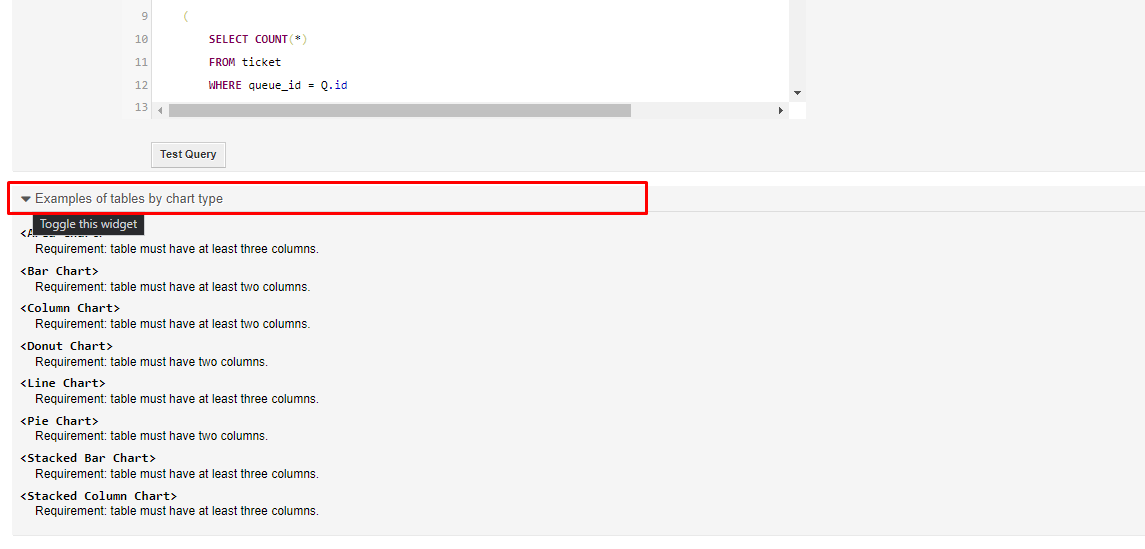
In the 'Options' field you can define an SQL query that the KPI will use as a basis for creating the chart. Remembering that the generated table must correspond to the selected chart type.
Also select the desired chart type.
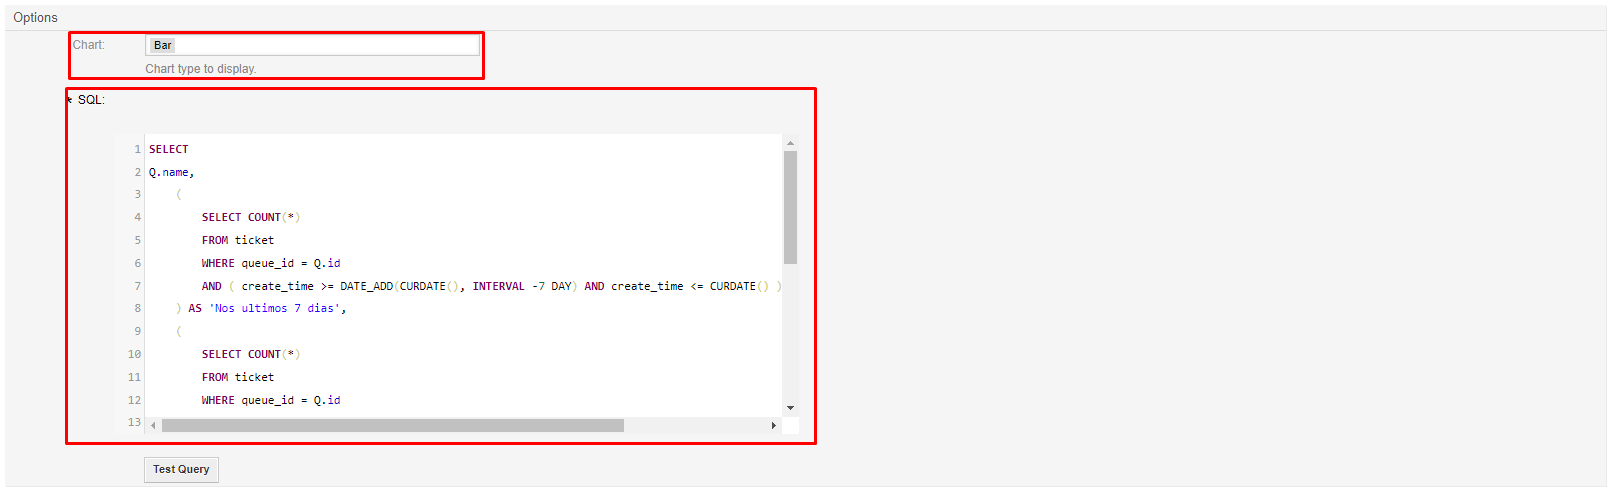
The test button shows the result of the query or if there were any errors with it.
If there is no error, the chart preview button will be enabled:
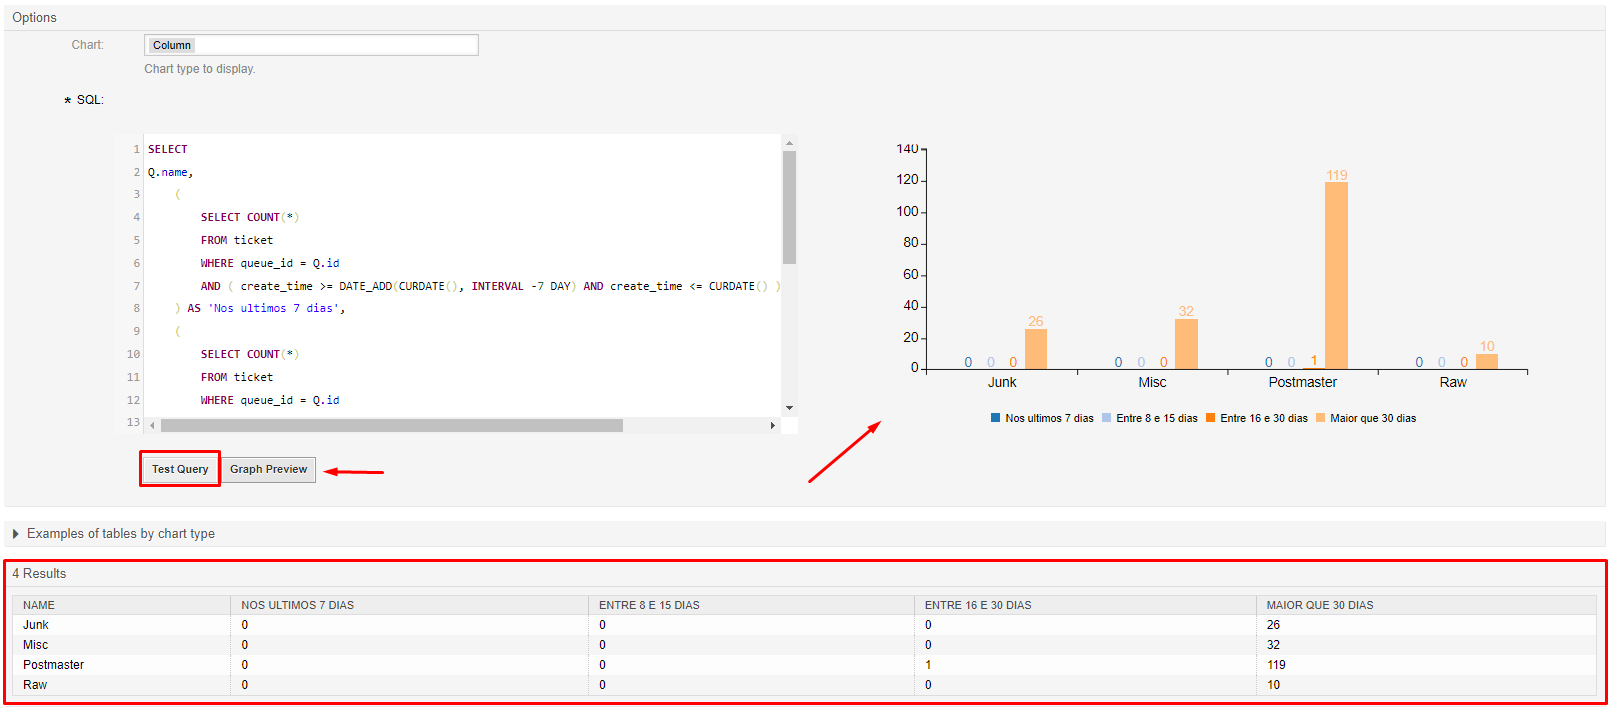
By clicking on 'Examples of tables by type of chart' it is possible to see the required return of the query by type of chart.
After that click save. You will be able to view the registered KPI, as well as delete or copy them:
- Selecting the item "Survey":
Enter the fields according to your preference in the 'General' field:
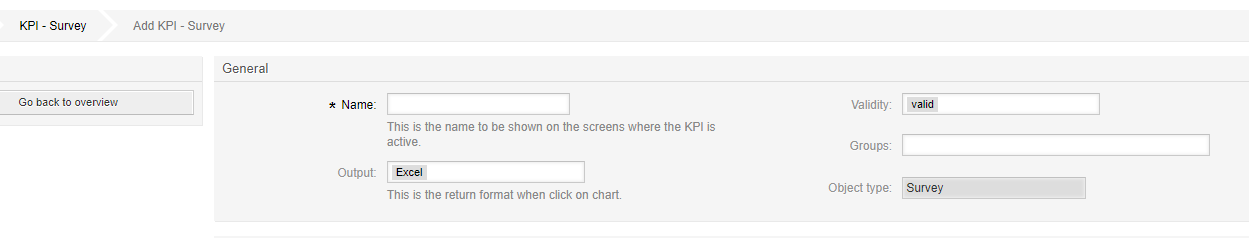
Name: This is the name to be displayed on screens where KPI is active.
Validity: Split between valid and invalid
Exit: This is the return format when you click on the graph. Currently this type of chart only supports Excel.
Groups: User Access Group
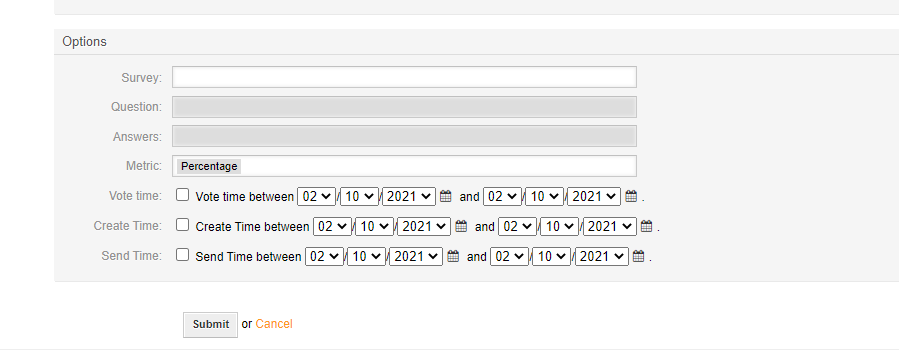
Then choose the desired options:
- Selecting the item "Config Items":
Enter the fields according to your preference in the 'General' field:
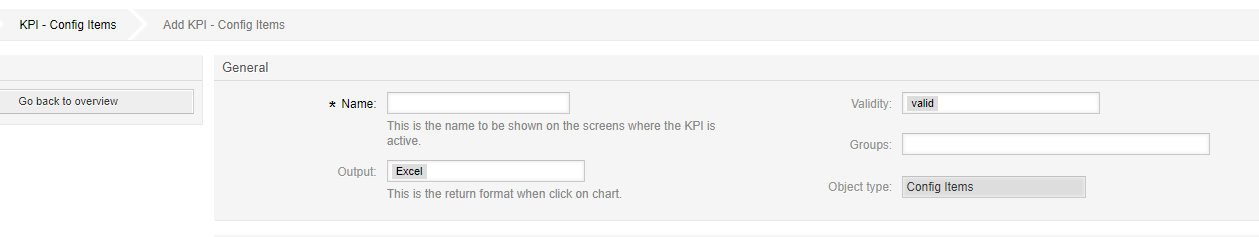
Name: This is the name to be displayed on screens where KPI is active.
Validity: Split between valid and invalid
Exit: This is the return format when you click on the graph. Currently this type of chart only supports Excel.
Groups: User Access Group
Then choose the desired options:
KPI Pool Creation
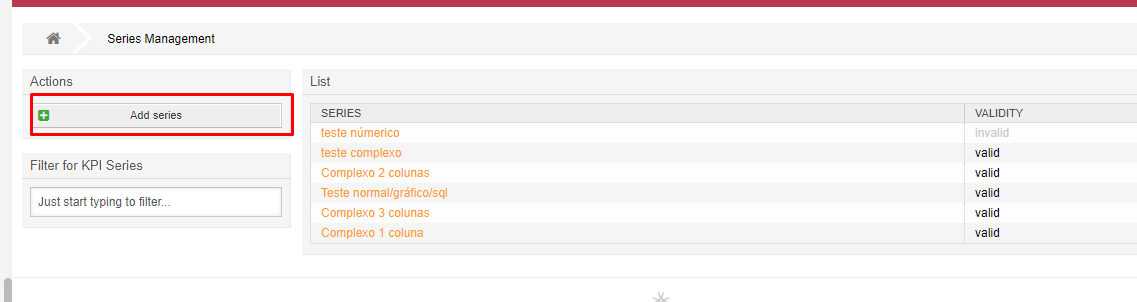
In the Administration tab we find the option "KPI Sets", select it:
Under Set Management, click “Add Set” to add a new set of KPIs.
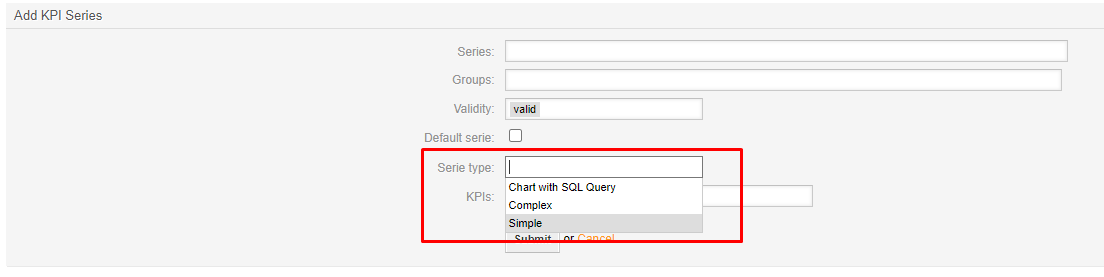
Define the desired fields as follows:
Set: Name for the set
Groups: Pool Access Groups
Validity: Valid or Invalid
Default serie: Sets whether the set will appear to users with no preferences chosen.
Set Type: You can choose 'Simple', 'Complex' or 'Chart with SQL Query'
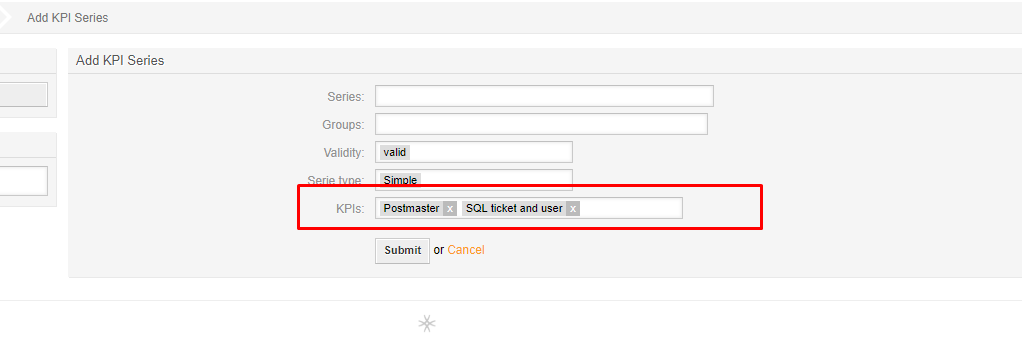
Choosing the type 'Simple', you must also fill in the field 'KPIs', where you will be provided KPI of type 'SQL Query' and type 'Call Search':
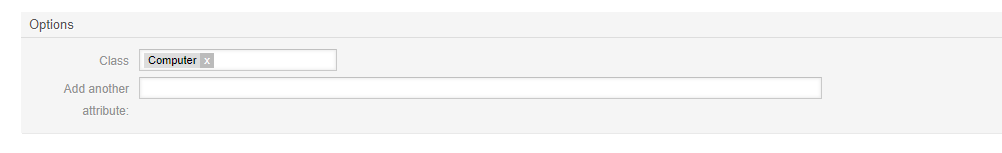
Already choosing the type ''Complex' or 'Chart with SQL Query'', you must choose the number of columns of this set:
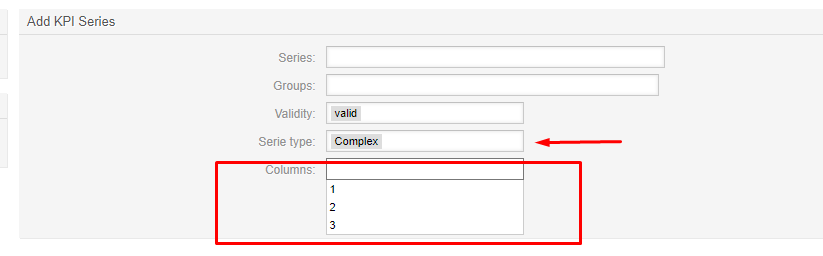
After choosing the quantity, fields will appear for each column:
Complex
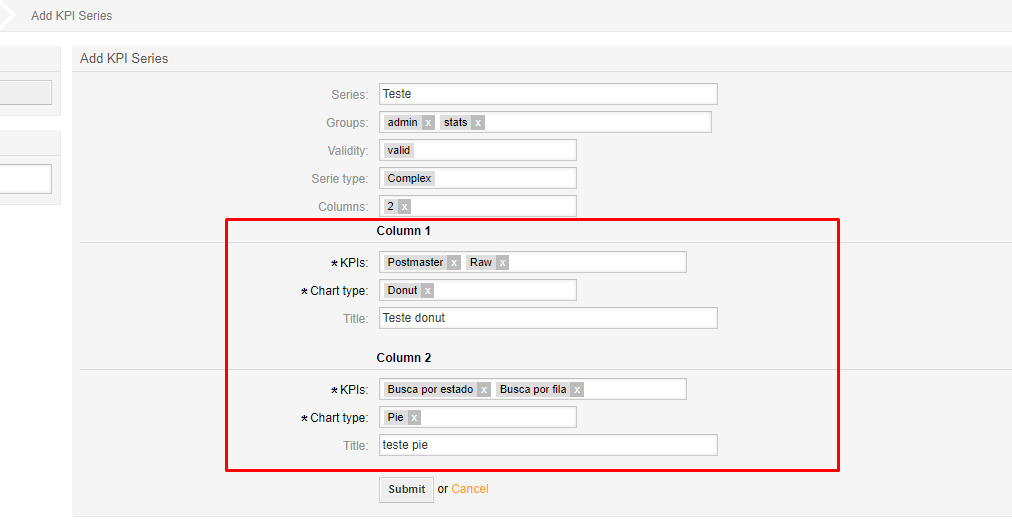
KPIs: KPIs that will make up the chart in this column, currently only listed 'Call Search' type KPIs,
Chart Type: chart type for this column,
Title: Chart title for this column
'Line' chart type: When choosing the complex line graph, it is necessary to define the scale for the graph. Remembering that the graph uses the opening date of the ticket to perform the filters.
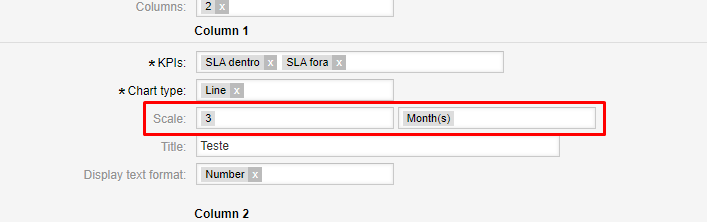
The scale will be the 'x' axis of the graph.
Chart with SQL Query
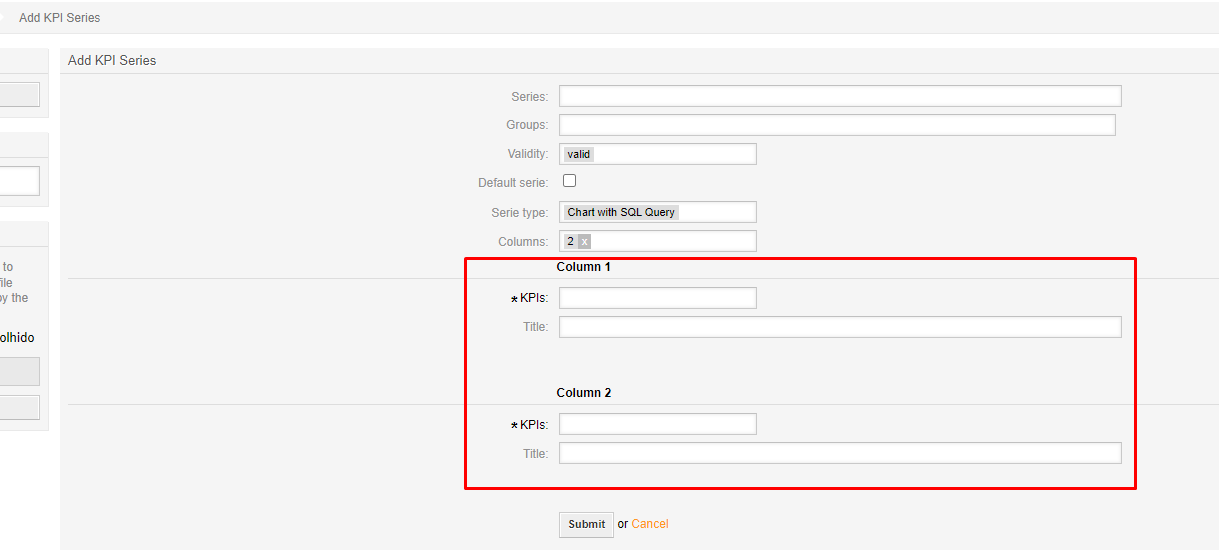
KPIs: KPIs that will make up the chart in this column, only listed 'Chart with SQL Query' type KPIs,
Title: Chart title for this column
KPI Scheduler
The KPI scheduler is responsible for sending KPI or statistics reports by email.
To create a new scheduler, navigate to the administrative interface and search for 'KPI Scheduler':
After that, click on 'Add scheduler' and fill in the parameters as desired:
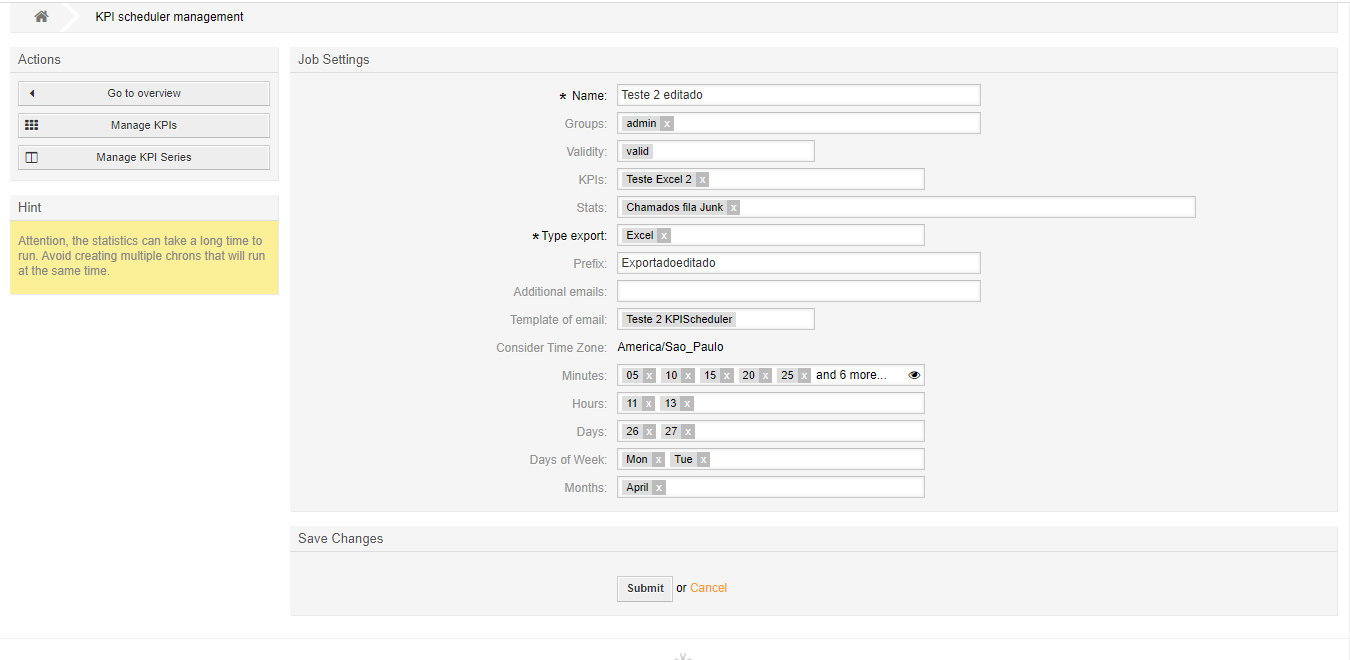
The email with the chosen report will be sent to all attendants participating in the chosen user group.
To add more than 1 additional email in copy, you must separate the emails with ','.
The prefix will be included before the chosen kpi name, or statistic number.
The email template will be sent according to the chosen template. Only 'KPIScheduler' models will be listed. The 'StandardTemplate::Types' config must have the KPIScheduler key.
Remember, the scheduler name must be unique. And the daemon must always be running in the environment.
Configuration to Scheduler
KPI::Core::TimeZone
Defines the time zone to the scheduler use
KPI::Core::DirectoryToSaveKPIScheduler
Defines the directory on the server where the report sent by e-mail will be saved
KPI::Core::ColumnsHTMLExport
Defines the columns of tables in HTML | If not filled in, it will have no effect.
KPI::Core::ExcelExport
Defines the columns of to export the search result in Excel format
KPI Preview
From the Dashboard menu, find the SubMenu "Overview" and select the "Settings" gear in the upper right corner of the SubMenu.
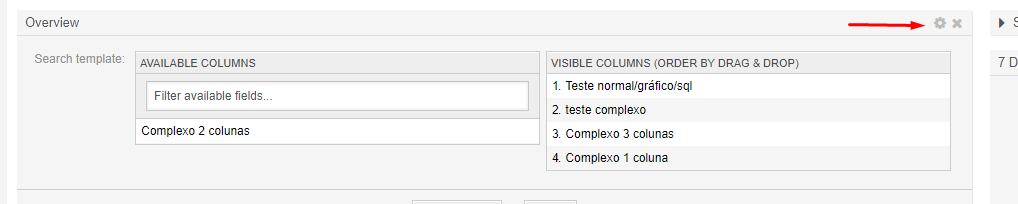
Under Available Columns, select and drag the created set to "Visible Columns". Save Changes.
We can now view the created KPI set.
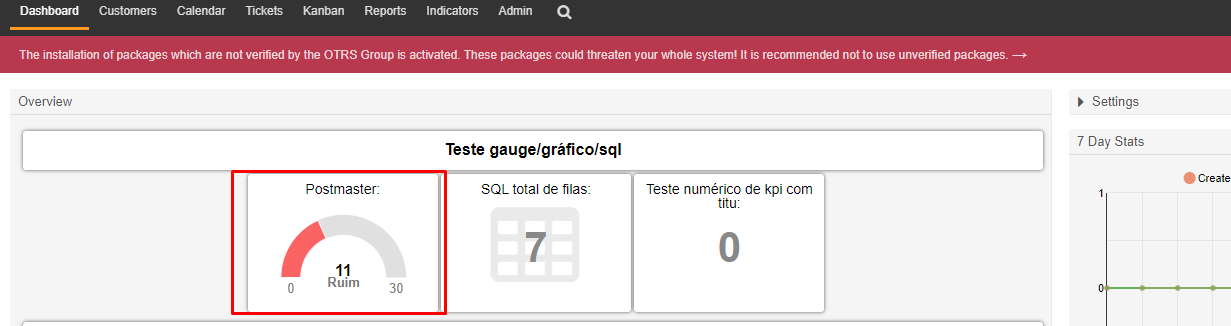
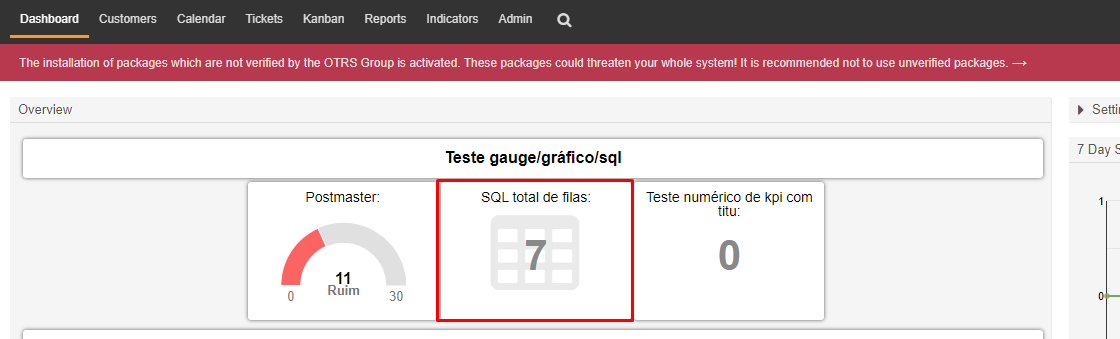
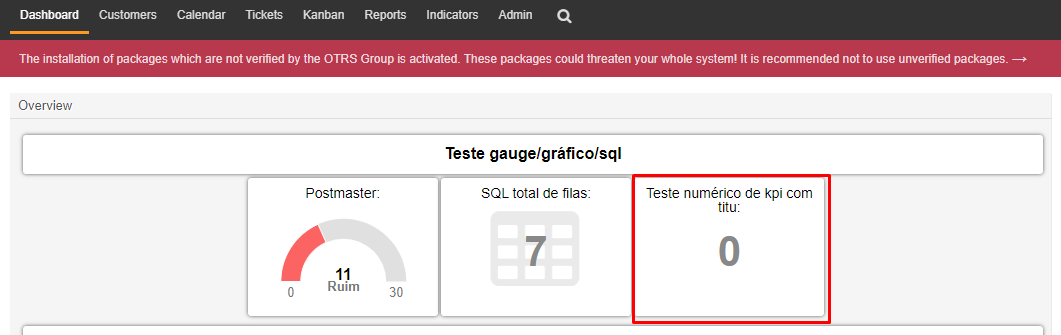
Simple Set Examples:
- Gauge Indicator:
- SQL Query Indicator:
- Numeric indicator:
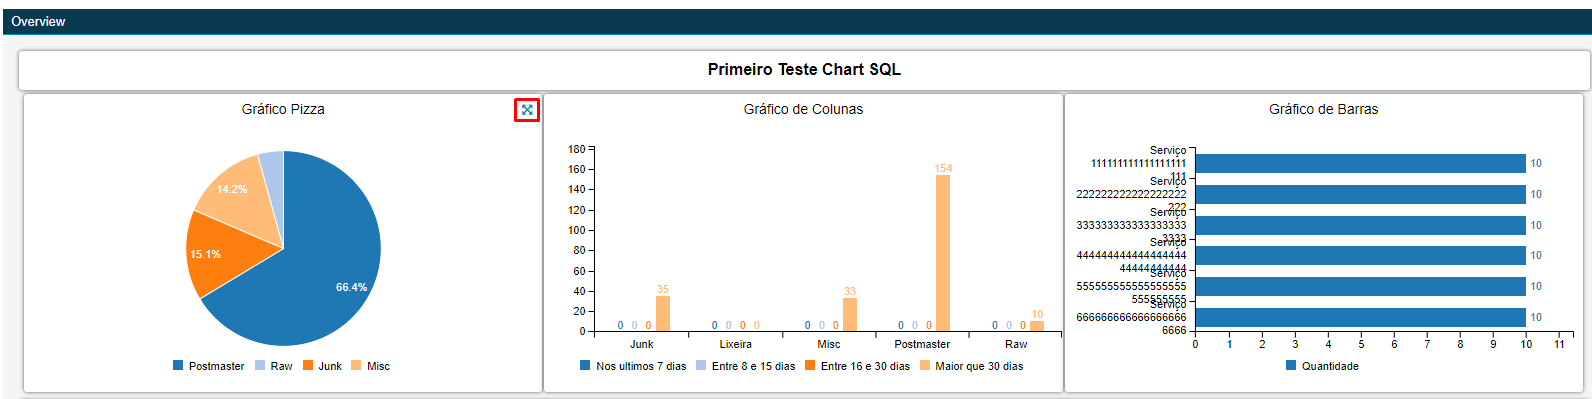
Complex set examples and 3 registered columns:
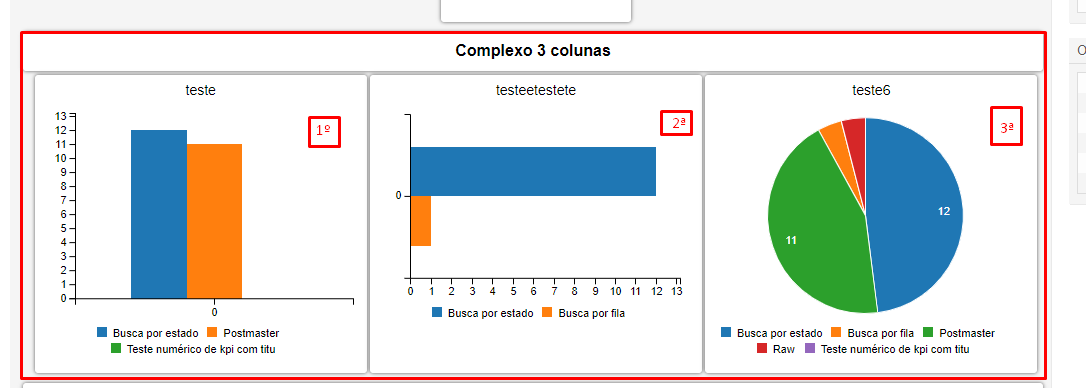
By clicking on the title of complex set charts, all chart values are exported. Already clicking on a sector, only the sector data will be exported.
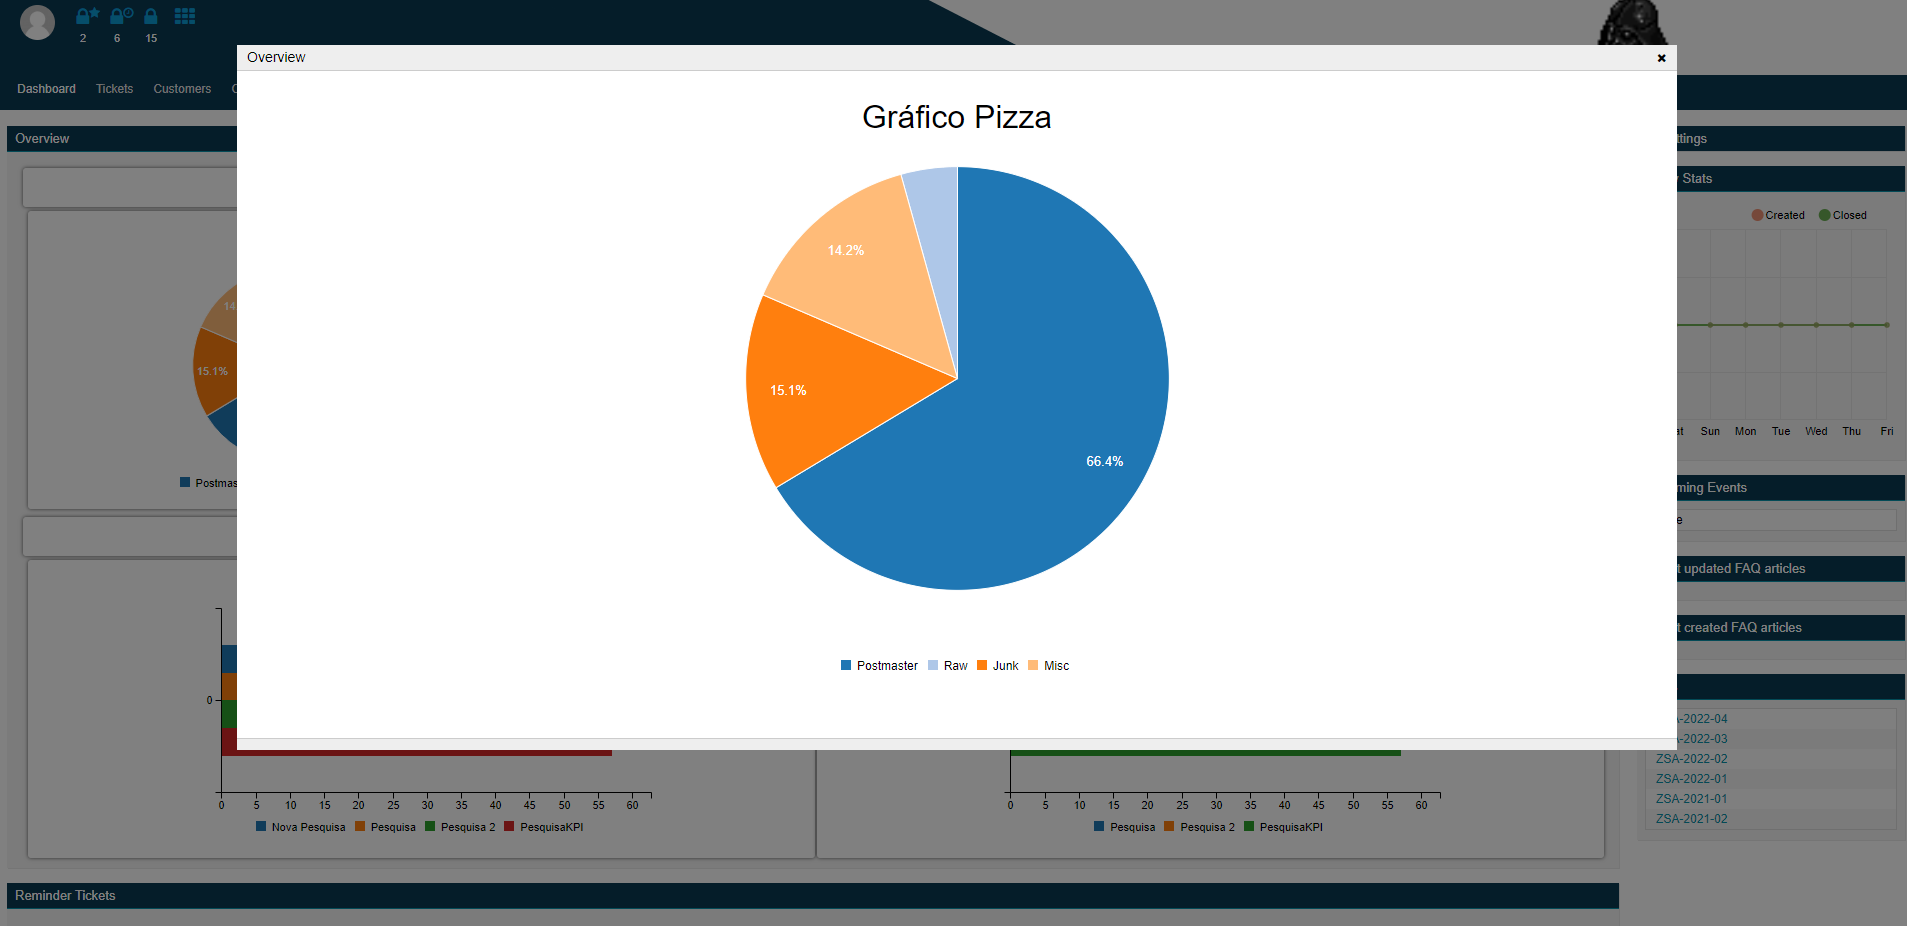
Note: Complex and Graph with SQL Query type KPIs have the option to expand. To do so, position the mouse on the desired KPI area and click on the icon.
Expand KPI
Color change
In the 'AgentKPIWidget' action in the 'Bookmarks -> KPI' menu, you can change the colors of the bookmarks to a dark background.
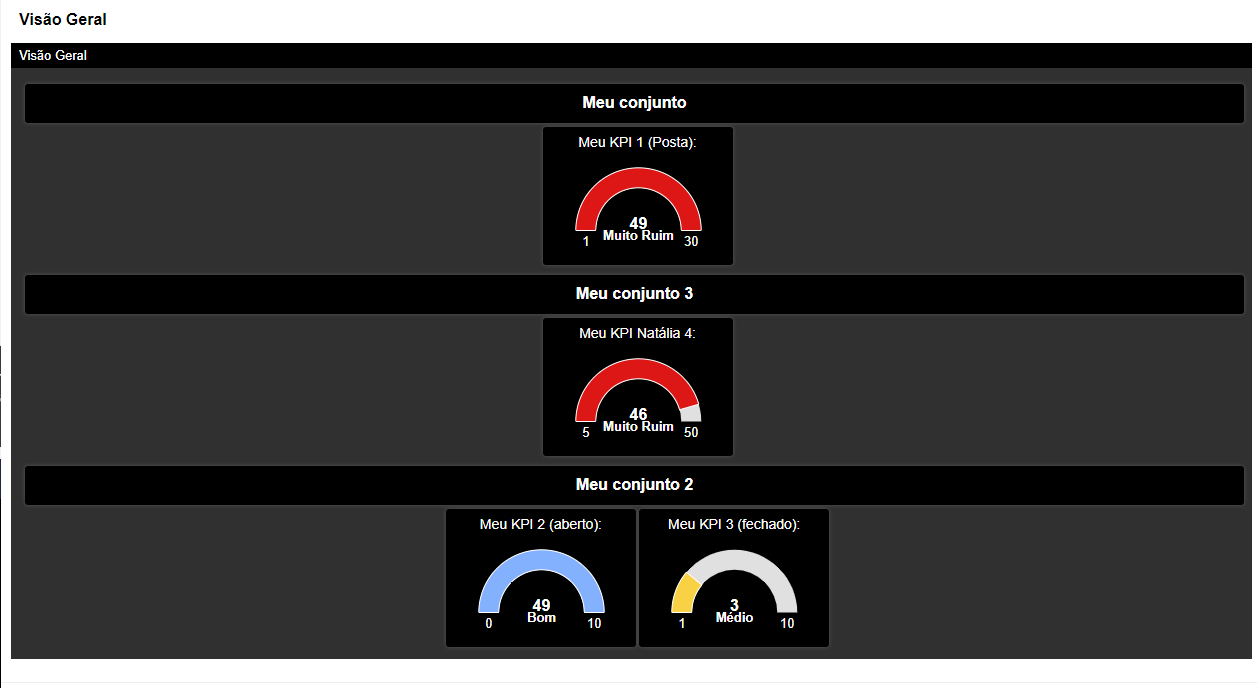
To do this navigate to the 'Indicators -> KPI' menu and click on the symbol below:
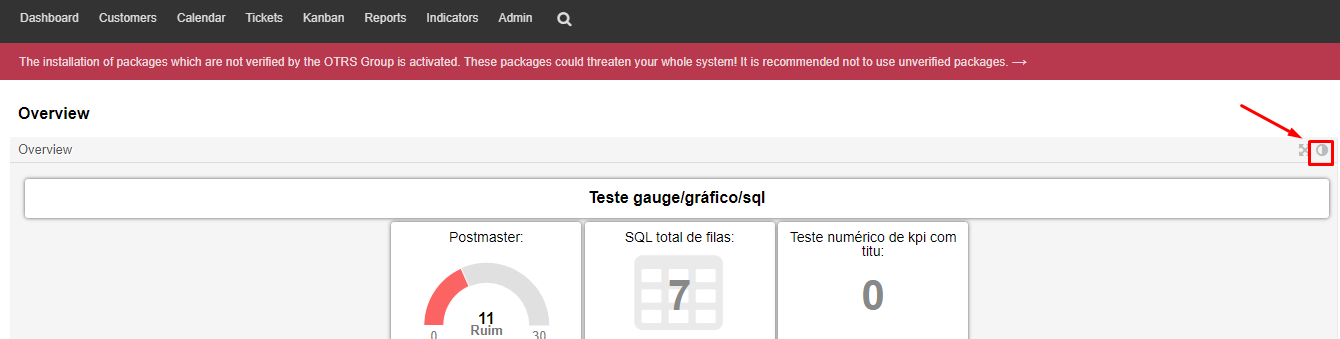
After that the KPI acquires the dark color:
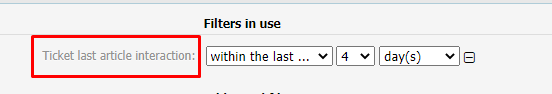
Extra filters KPI
Ticket Last article interaction
get the tickets that had the last article interacted by the agent
- within the last ...
returns tickets that had interaction in the last period and open tickets that did not have attendant interaction in the last period
- more than ... ago
returns tickets that had interaction prior to the selected period and returns open tickets that had no operator interaction prior to the selected period
Use tag in KPIChartSQLQuery
It is possible to use the <OTRS_SELF_USERID>) tag in SQL queries, where it will be replaced by the UserID of the logged in user.
Dashboard Creation
Note: Upon installing the module, a default dashboard and four example KPIs will be created.
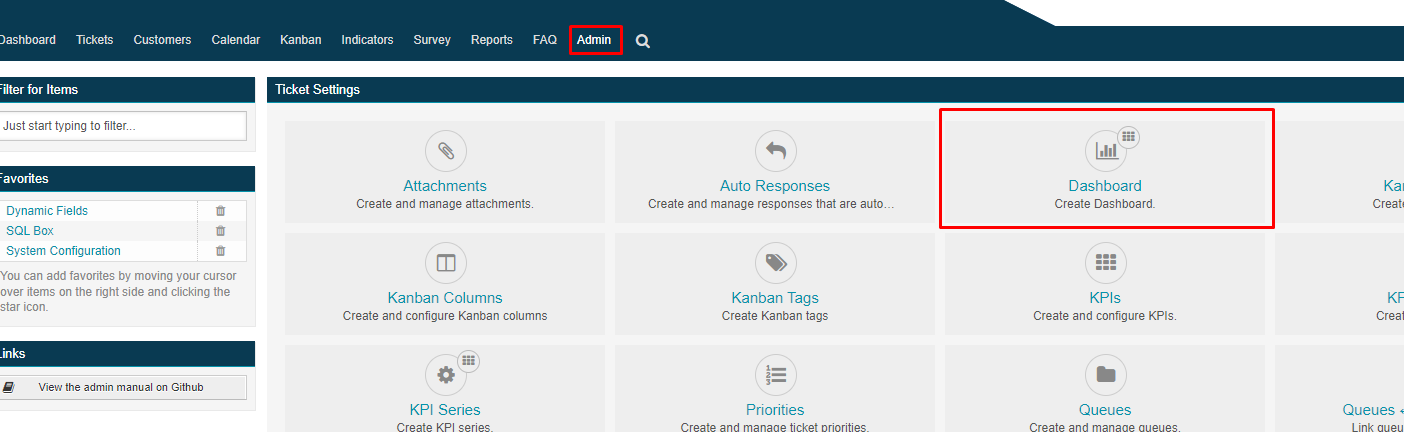
Go to Overview in the Admin option and select Dashboard (Create Dashboard).
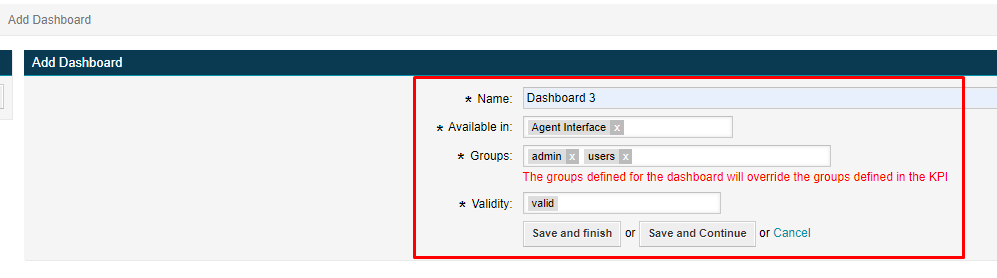
Click Add Dashboard.

- Give the dashboard a name;
- Select the interface that the dashboard will be displayed on;
- Select the group that will have viewing permission;
Note: In version 6.8.27 only the agent interface is available.
Attention: The dashboard group will override the kpi group.
You can click save and finish or save and continue.
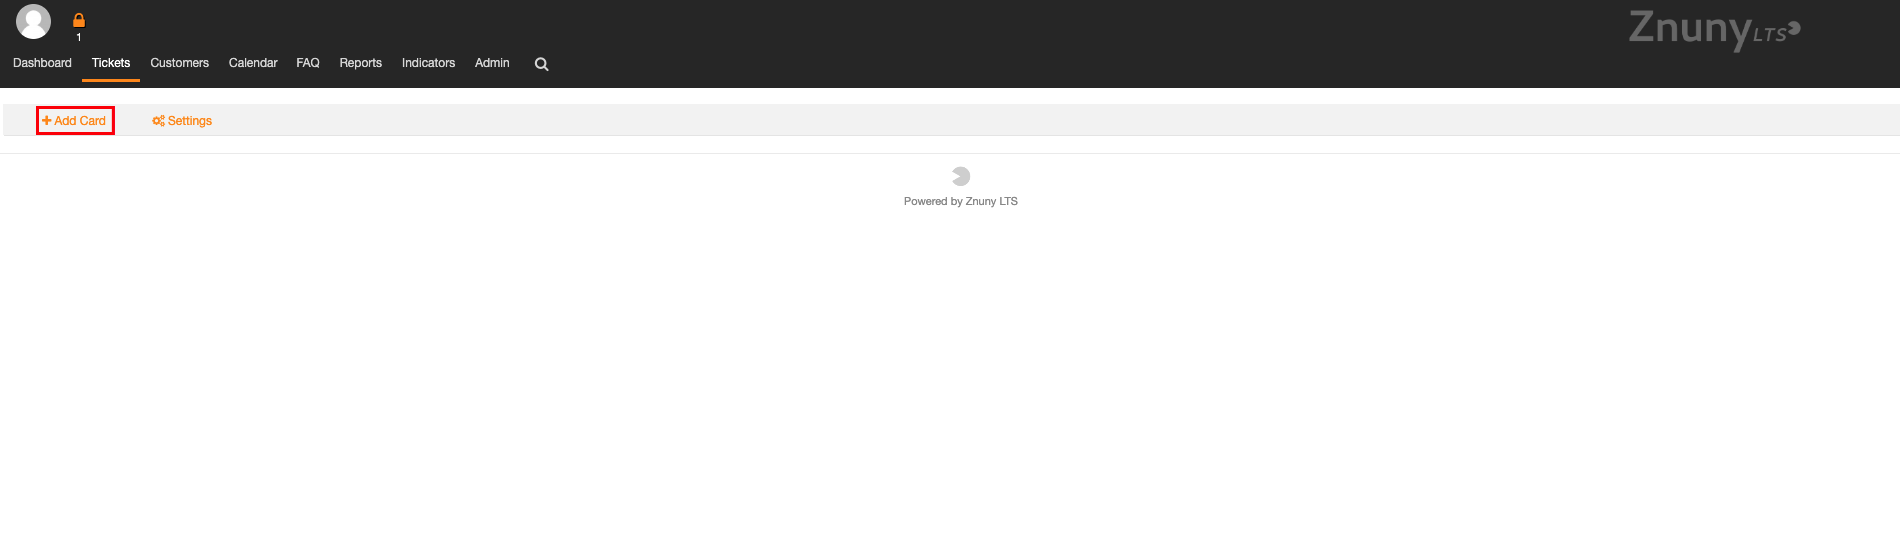
If you click Save and Finish, you will be taken to the previous screen. If you click Save and Continue, you will be taken to the dashboard creation screen.
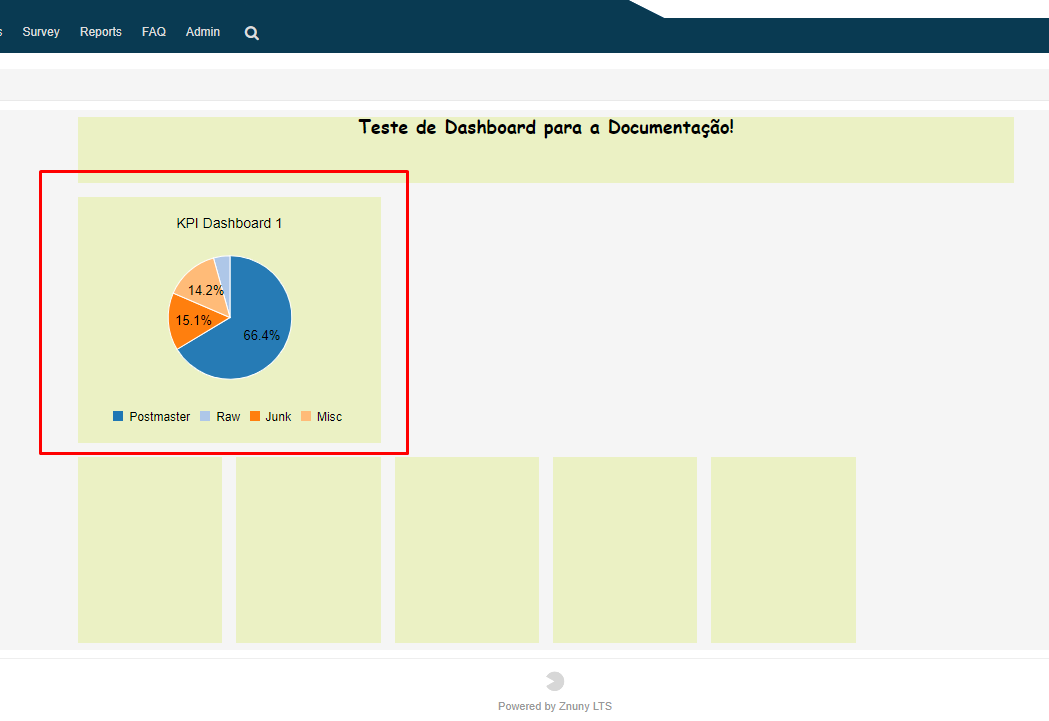
Click Add Card. You can add as many cards as you like.
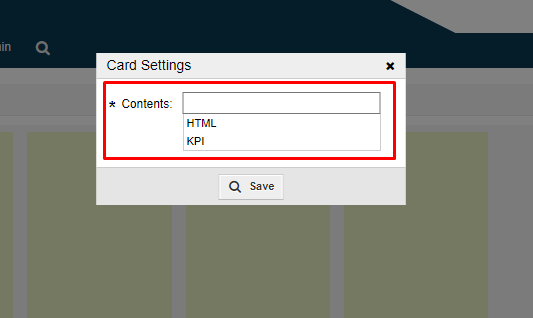
When positioning the mouse over the card, two options will be displayed. The first one will open the card settings, where you can configure its content. In the second option it is possible to delete the card.

Two options will be displayed: HTML or KPI
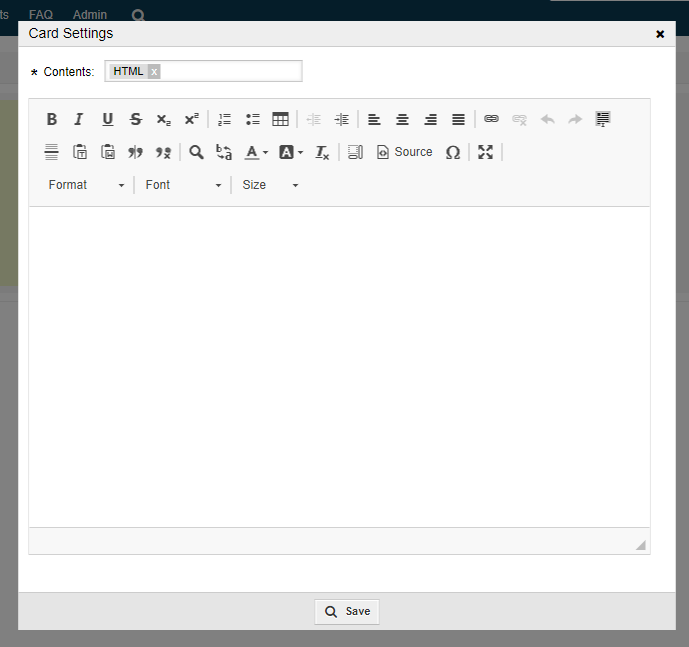
In the HTML option it is possible to place texts, images and so on. It is possible to use the 'Source' function and add html code.
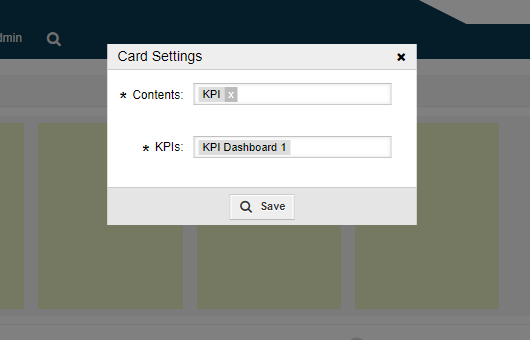
In the KPI option it is possible to select a KPI that will be displayed on the card.
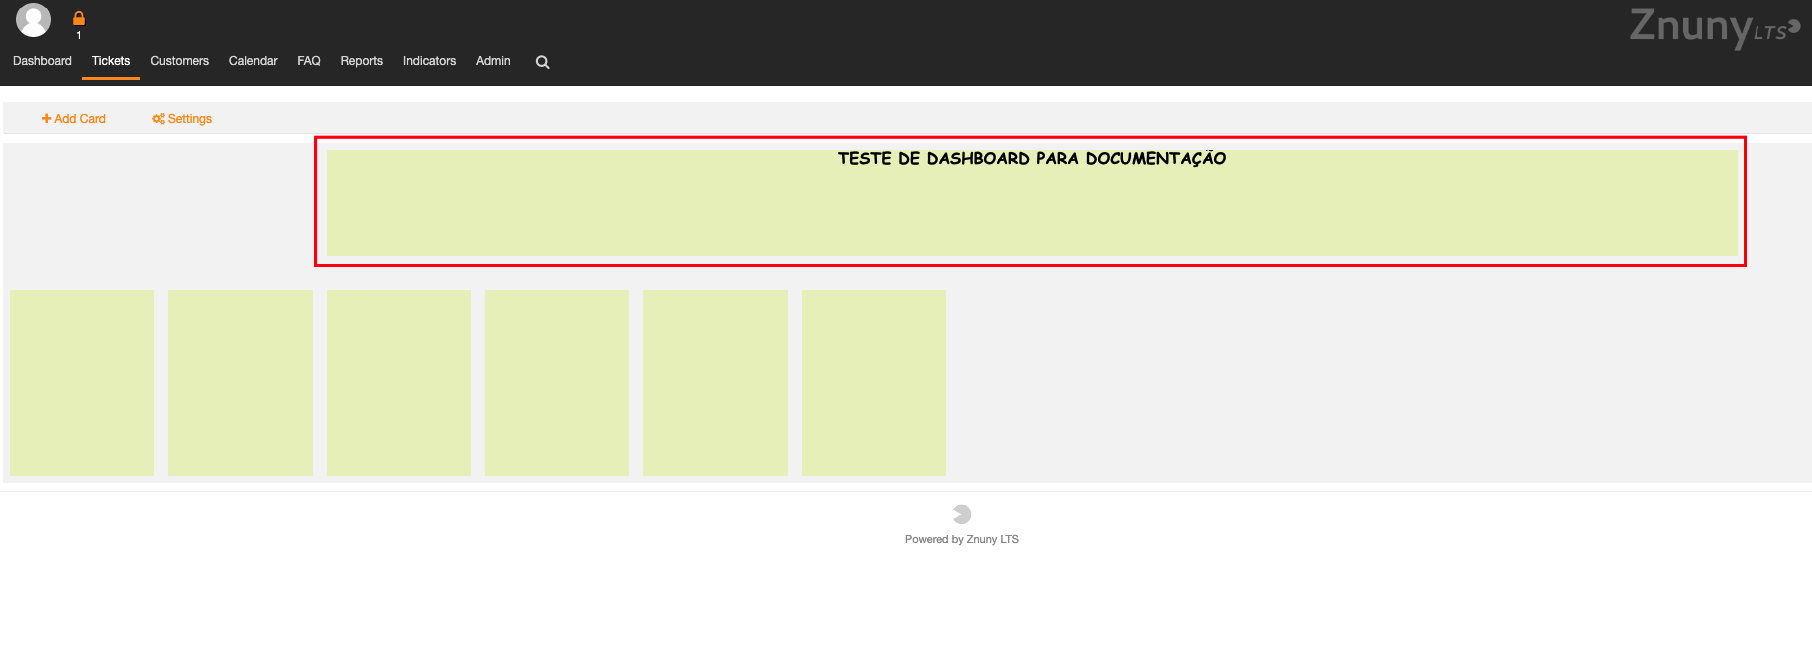
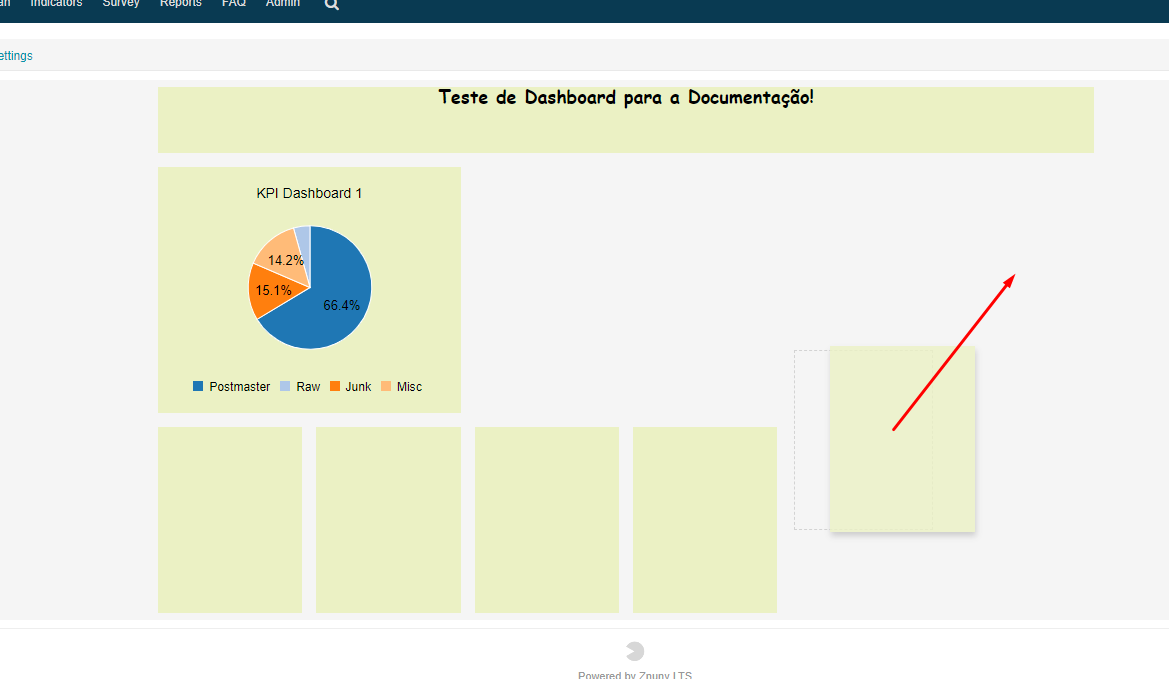
Click on the card and drag it to where you want to place it.
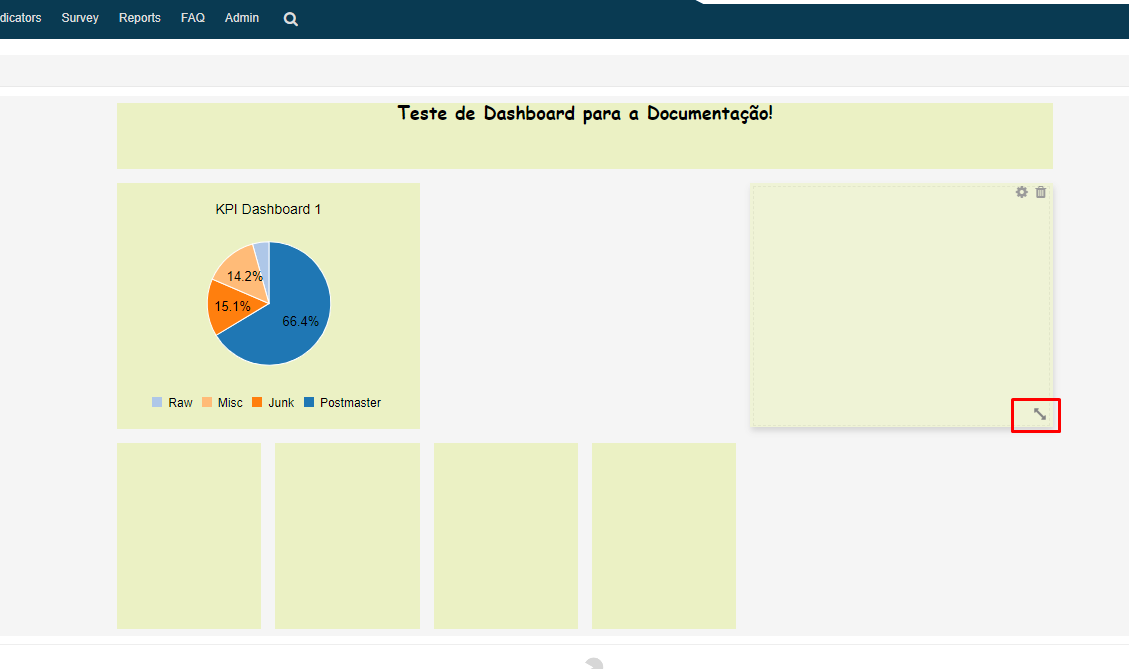
To resize the size, place the mouse over the card, click and drag the arrow as shown in the image.
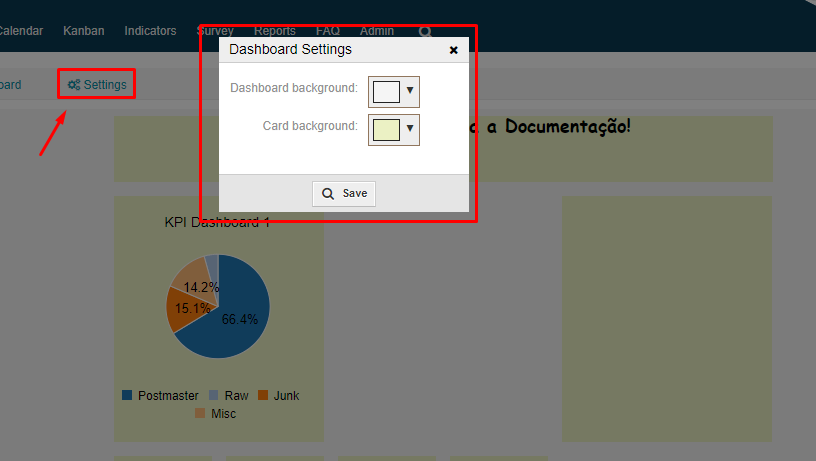
In Settings you can change the background color of the dashboard and cards.
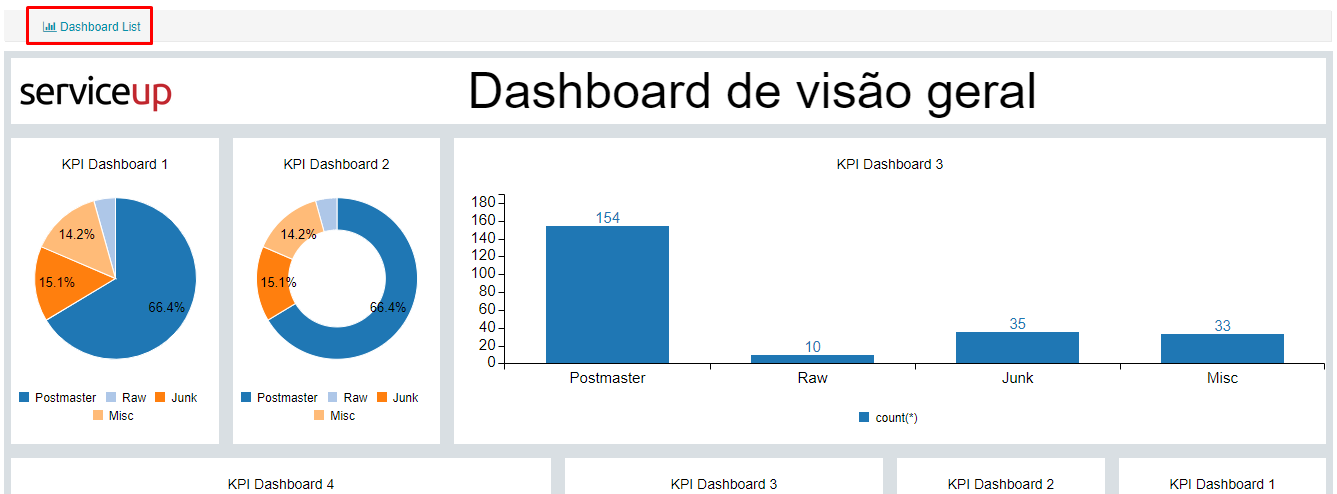
Dashboard View
By clicking on the Indicators option, in the navigation menu, we will have the Dashboard option.
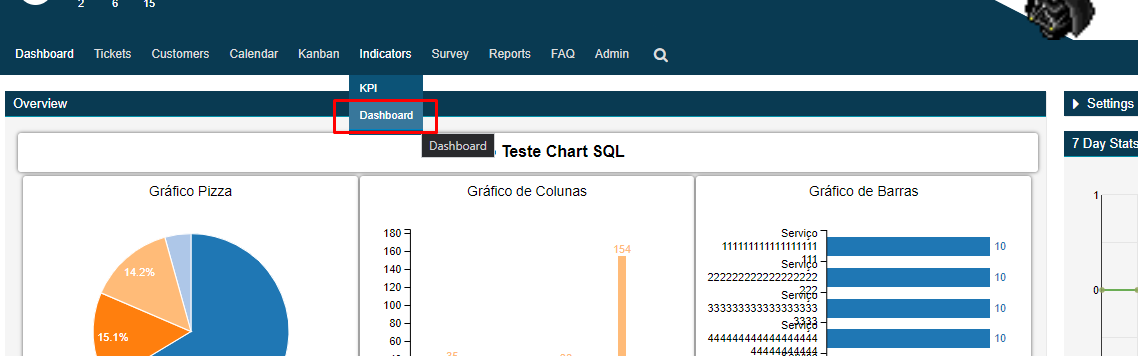
All dashboards that the attendant has permission to see will be listed.
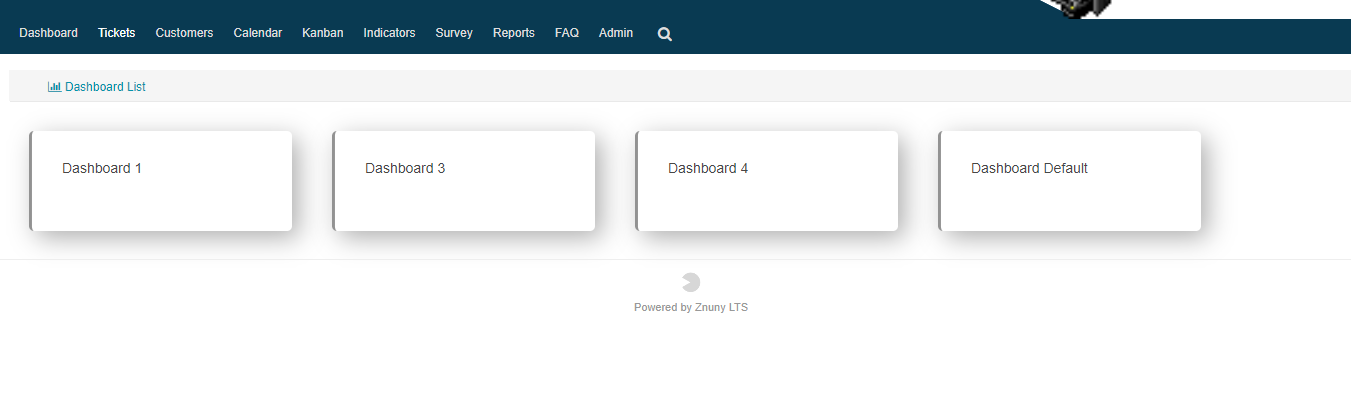
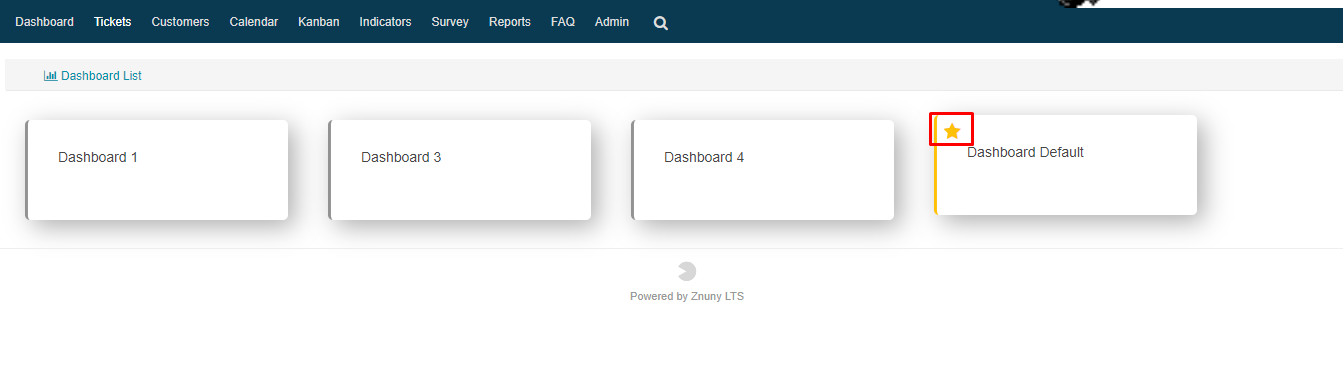
You can click on the desired dashboard or bookmark it. If you have a favorite dashboard, when you enter this screen, it will be displayed, instead of the list of dashboards.
If you want to see the available dashboards, just click on the Dashboard List option.